Project Details
A logistic company lacks visibility into delivery performance, revenue drivers, operational efficiency and customer behaviour due to fragmented CRM and ERP data.
Goal
The goal is to provides a unified view to optimize operations, improve delivery performance and increase profitability. To accomplish this, we will analyze logistic data from an API containing information on Customer, Drivers, Route, Order, Revenue, and Deliveries.
Download from Raw Dataset!Setup
To start the project, data cleaning was performed to ensure accurate analysis. This included the removal of duplicate entries to avoid potential biases in the dataset. Furthermore, the data was updated to be more interpretable, such as removing useless API columns, removing "NGN and ₦ from currencies, removing "km" from distance, fixing date columns, standardized text fields, split customer location, handled nulls and errors replacing. The raw dataset contained unrealistic route IDs and inconsistent location mappings. I implemented a location reference table and derived route logic to ensure analytical integrity. Additionally, I ensured there was no missing data and that each field had the correct data type. Finally I transformed the flat dataset into a structured star schema with fact and dimension tables, improving data model performance and enabling scalable analytics.
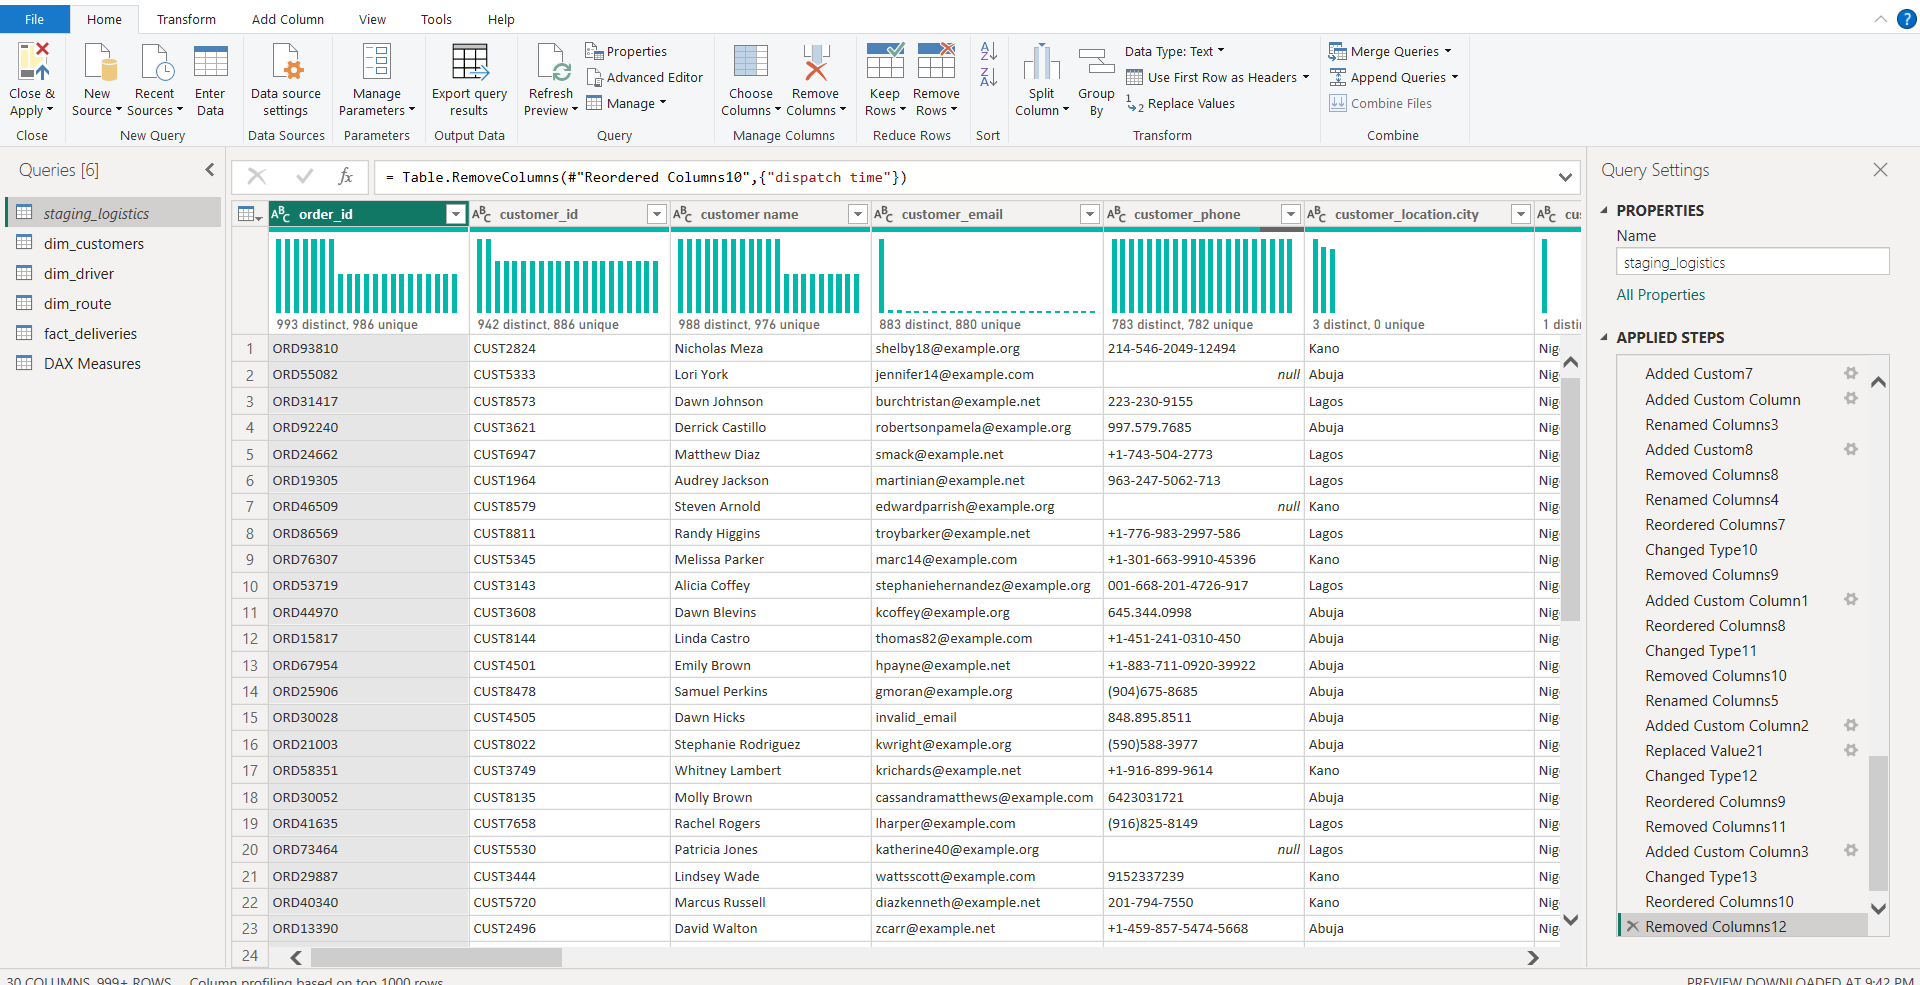
Fig 1. This image shows the dataset after it was cleaned.
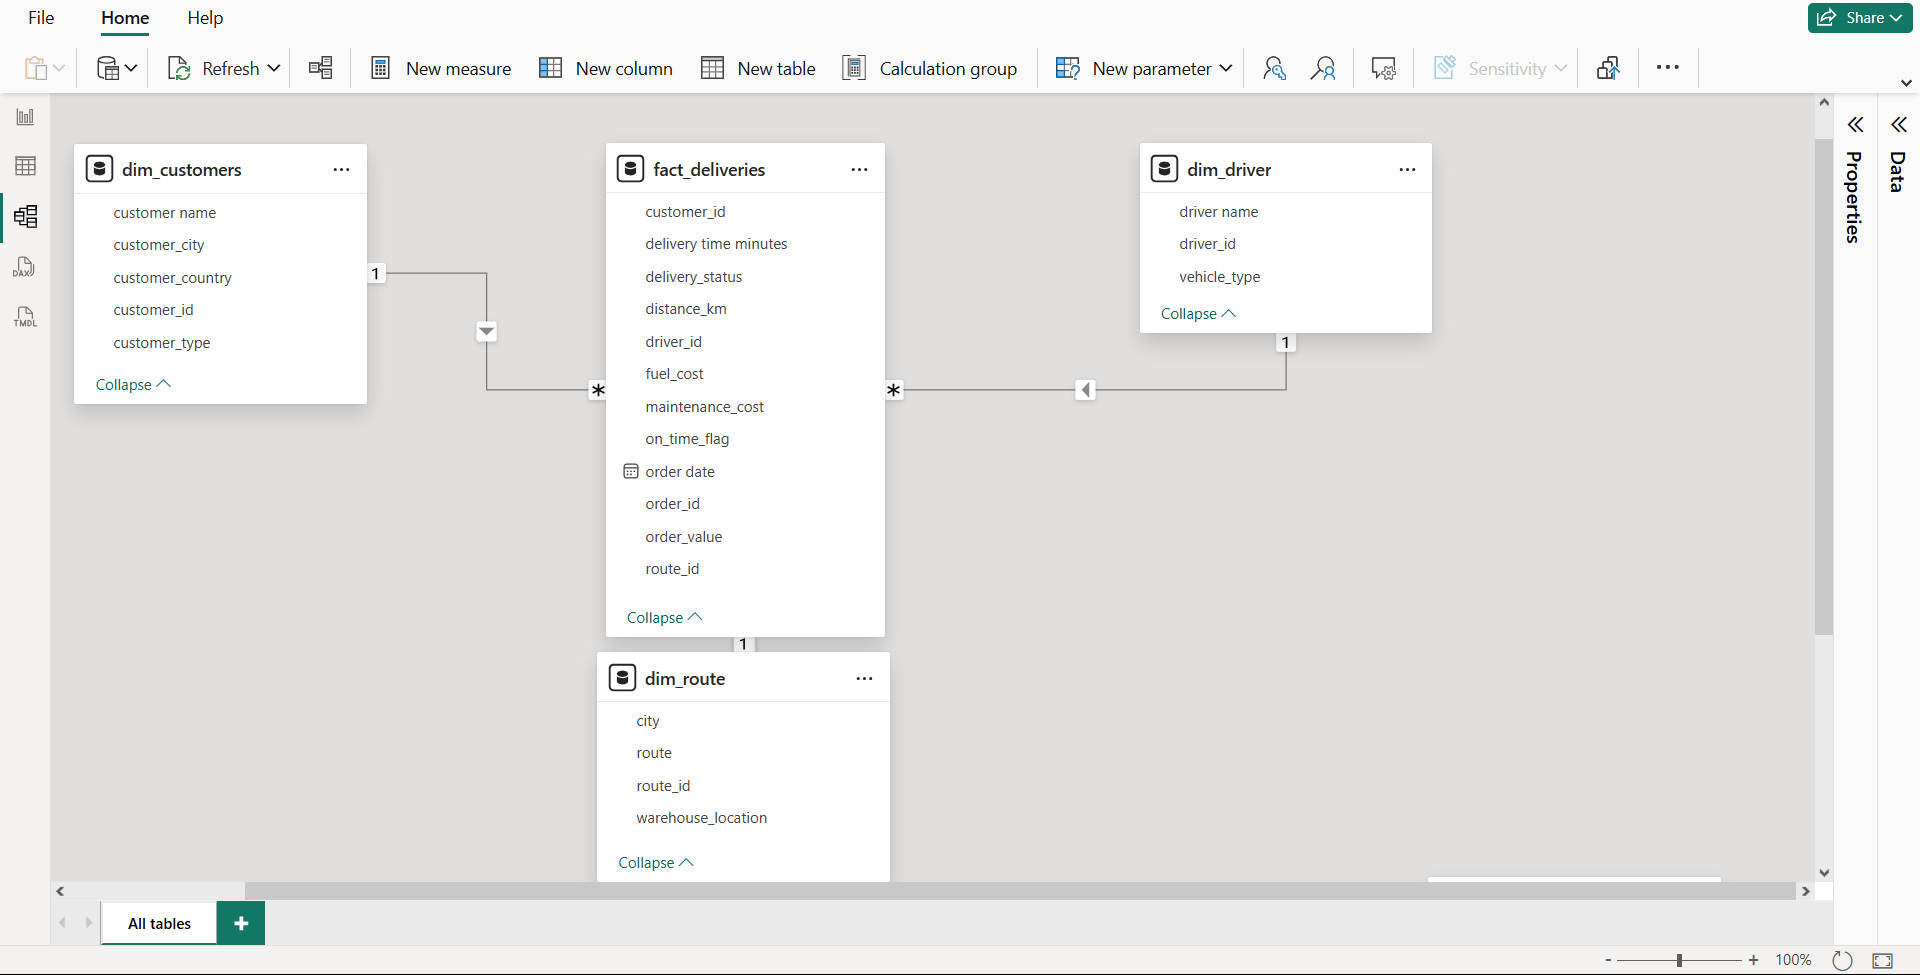
Fig 2. This image shows the dataset structured Star Schema.
Analysis
Now that we have clean data, we can perform exploratory data analysis to gain insights and patterns in the data.
Business Questions:
- What is the overall performance of the business?
- Which drivers are driving revenue and operational success?
- How efficient are our logistics operations?
- Who are our customers and how reliable are they?
Data Exploration
I started by developing advance DAX measures including time intelligence, ranking and performance KPIs to enable operational and strategic decision-making.
To make it easy I designed a 2 page executive dashboard addressing key business questions across revenue performance, driver efficiency, operation optimization and customer behaviour using a structured star schema and advanced DAX measures.
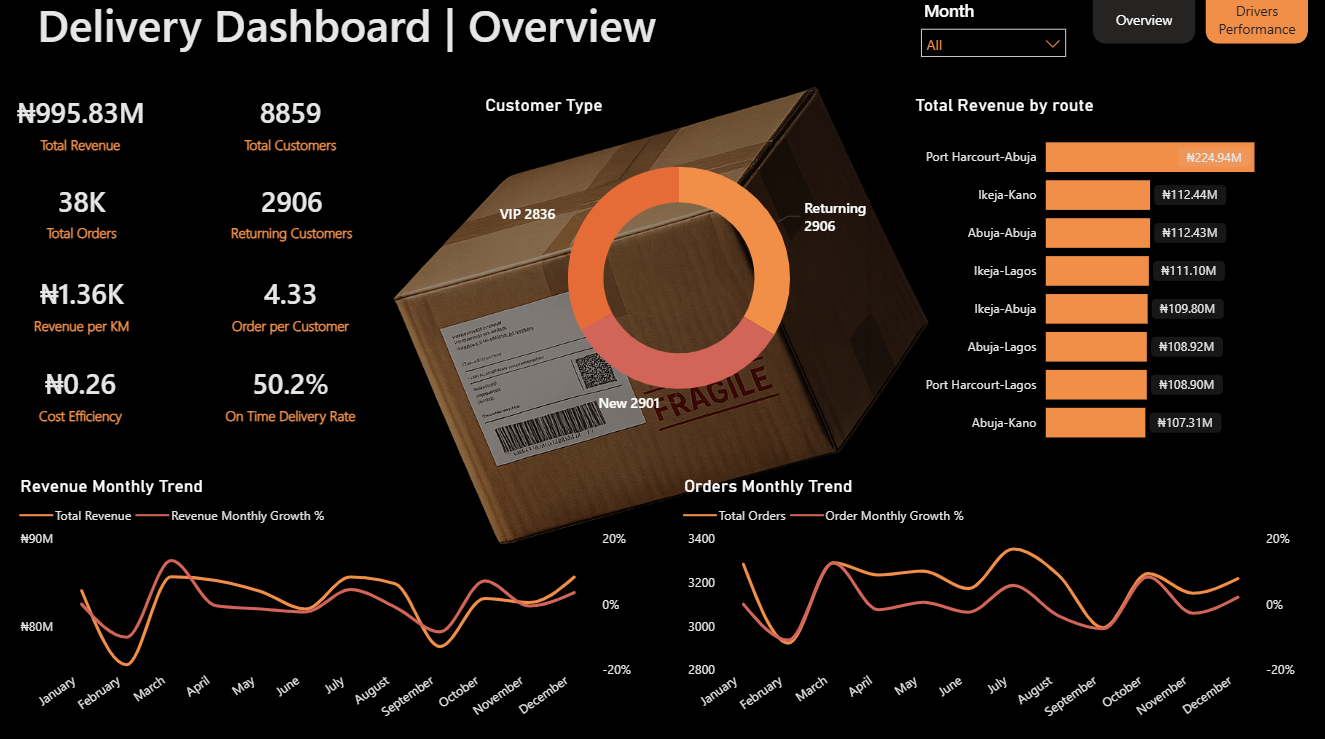
Fig 3. This image shows the Delivery Dashboard Overview.
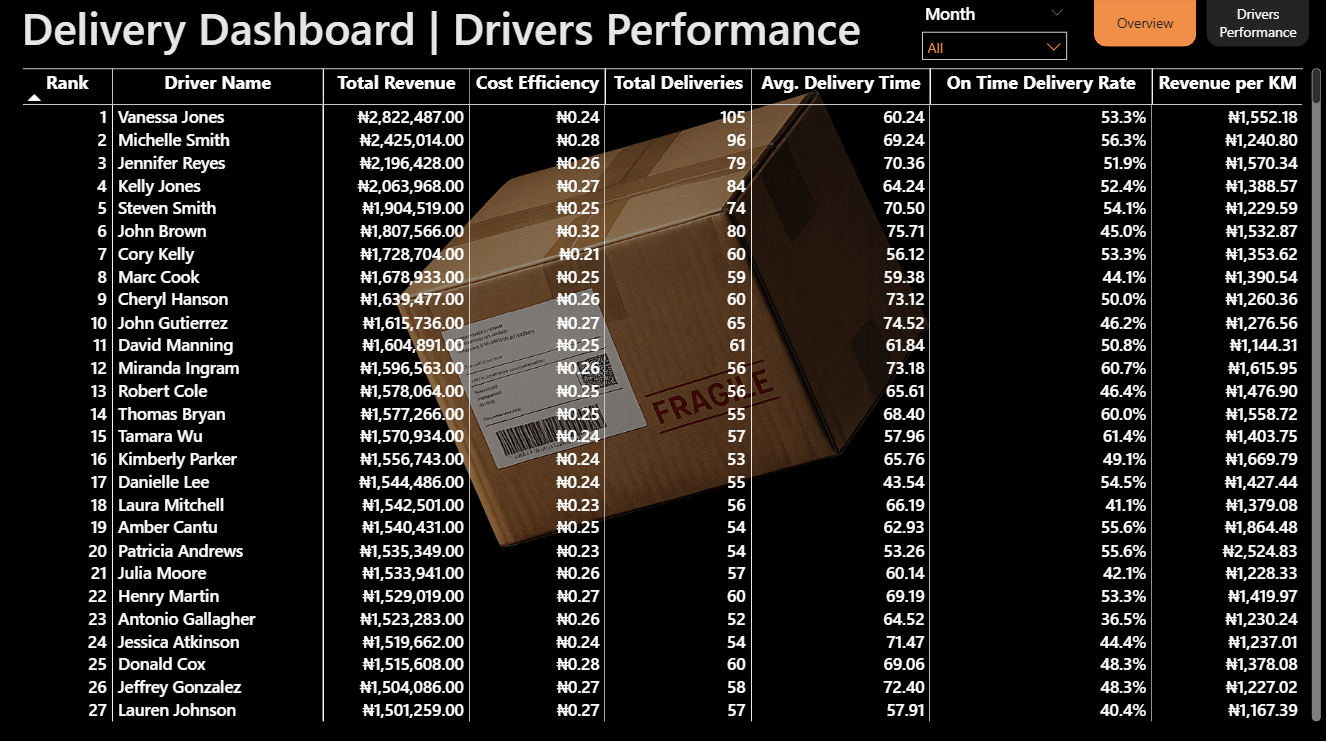
Fig 4. This image shows the Driver Performance Table.
Key Findings
Using the dashboard, we were able to determine the following insights:
- Overall Business Performance: The business is generating ₦995.83M in total revenue across 38K orders from 8859 customers, with an average of 4.29 orders per customer, a healthy repeat-purchase signal. Revenue per KM sits at ₦1.36K, and the monthly trend charts show a consistent revenue band between ₦84M–₦85M, with a notable spike toward ₦85M+ in November–December, suggesting seasonal demand. Order volume mirrors this pattern, oscillating between 3,800–4,200 orders/month with the same late-year uptick. Growth is stable rather than explosive, the Monthly Growth % lines hover near 0%, meaning the business is mature and consistent but not in a high-growth phase.
- Which Drivers Are Driving Revenue & Success: Vanessa Jones is the clear overall leader highest revenue, most deliveries, and competitive efficiency (₦0.24 cost, ₦1,562/KM). Barbara Heath stands out as a route efficiency star only 28 deliveries but ₦2,563/KM, nearly double the average, suggesting she runs high-value routes with excellent distance economics. Nicole Benson (Rank 868) at 42 deliveries but has the highest cost efficiency ratio (₦0.41) and an above-average on-time rate (52.4%)
- How Efficient Are Logistics Operations: Cost Efficiency: ₦0.26/unit — lean, but driver-level variance is wide (₦0.21 to ₦0.31), meaning some drivers are 48% more expensive per unit than others On-Time Delivery Rate: 50.2% — this is the biggest red flag. 2 out of 3 deliveries arrive on time. At the driver level, the best is ~75.0 (Cheryl Page) and several drivers are in the 24–48% range, which is operationally poor Revenue by Route: Port Harcourt–Abuja dominates at ₦224.94M, roughly 2x the next-best routes (Abuja–Abuja, Ikeja–Lagos at ~₦112M). This concentration is both an asset and a risk
- Who Are Our Customers & How Reliable Are They: The segments are almost perfectly balanced, which is unusual and worth verifying in the data model. Typically you'd expect a pyramid (many new, fewer VIP). If accurate, it means the business has an exceptionally strong retention and loyalty engine, nearly two-thirds of customers are repeat or VIP. The 4.28 orders/customer average supports this. The risk is customer acquisition: new customers are only 1/3 of the base, so if churn increases, the pipeline may not replenish fast enough.
Recommendations
Based on these findings, the business can implement the following actionable steps to improve operations:
- Investigate the 50.2% on-time rate, identify whether it's route-specific, driver-specific, or systemic
- Protect the Port Harcourt–Abuja route, it's generating 2x competitor routes; any disruption would be disproportionately damaging
- Study Barbara Heath's route assignment, her ₦2,563/KM is a model worth replicating across other drivers
The Delivery Dashboard reveals a stable, profitable logistics operation with strong customer loyalty but meaningful operation gaps that are limiting its growth ceiling.